We recently enhanced the Technical Debt calculation in CAST Highlight which has enabled new possibilities to visualize and analyze the technical debt of an application portfolio. One such scenario is automated prioritization of recommended remediation efforts using the new Portfolio Advisor for Technical Debt. This article explains how the Portfolio Advisor for Technical Debt works and how to use it to build informed action plans for tackling technical debt across an application portfolio.
Visualize technical debt to better tackle it
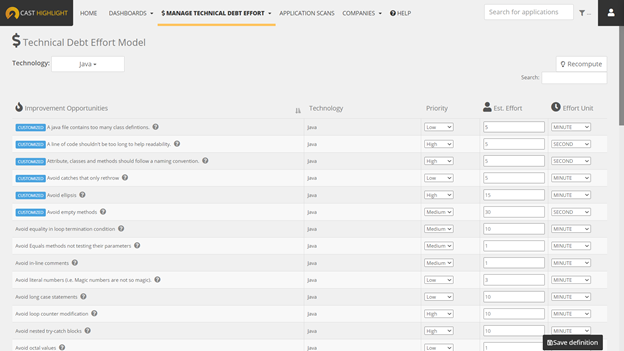
Technical debt is a useful measure to analyze the health of an application portfolio and start prioritizing and quantifying remediation effort. In a recent release, we enhanced CAST Highlight’s technical debt estimates to make it more powerful, accurate and flexible. It is now time to illustrate this with the Portfolio Advisor for Technical Debt!
There is now a new way to visualize and navigate the technical debt of applications to help users understand how it is structured:
- Does more technical debt come from software resiliency or from software agility programming practices?
- What is the technology stack that is generating most of the technical debt?
- Does technical debt originate from just a few code insights or is it more due to a broad array of programming practices?
- More interestingly, what is the contribution of high-priority code insights to technical debt versus medium and low-priority?

How it works
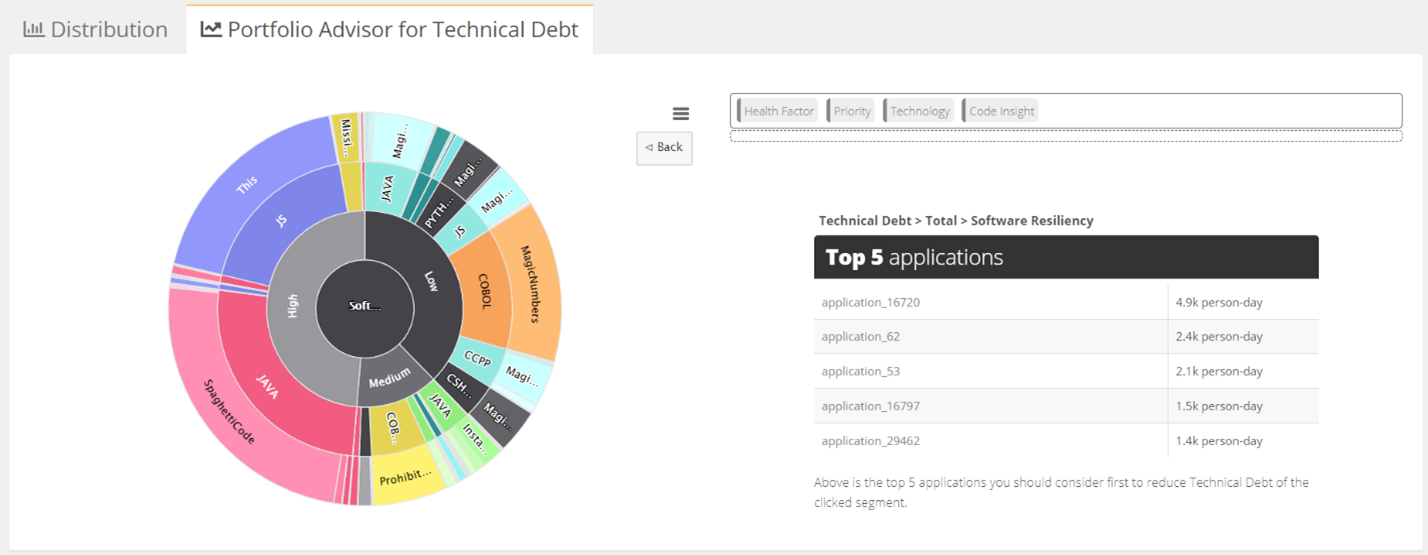
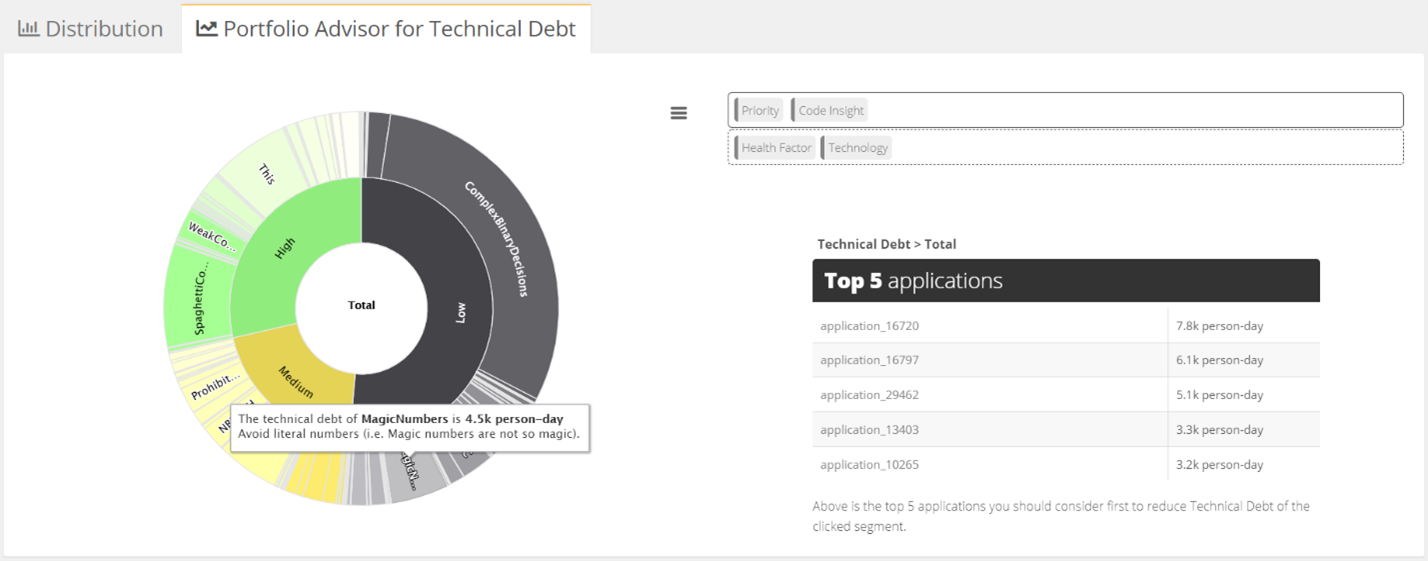
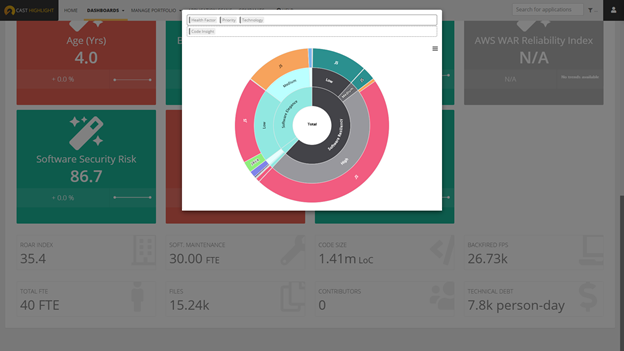
At the portfolio level, go to Dashboards > Technical Debt, then click on the “Portfolio Advisor for Technical Debt” tab. The “sunburst” chart displays the four layers of technical debt:
- Software Health factors: Software Resiliency, Software Agility, Software Elegance. The size of each segment is determined by the amount of consolidated technical debt of all code insights attached to a given health factor.
- Priority: high, medium, low. The size is determined by the amount of technical debt of code insights grouped by priority within a given health factor.
- Technology: Java, Python, COBOL, etc. The size is determined by the amount of technical debt of code insights grouped by programming language.
- Code Insights: the size is determined by the amount of technical debt for a given code insight.
Click on a specific segment to drill-down into it and display the “Top 5 applications” to the right of the chart. The list of applications is updated as soon as you click on another segment and shows the applications having the most accumulated technical debt for the selected segment. Clicking on the central segment will drill-up, back to the upper layer view.


SHARE